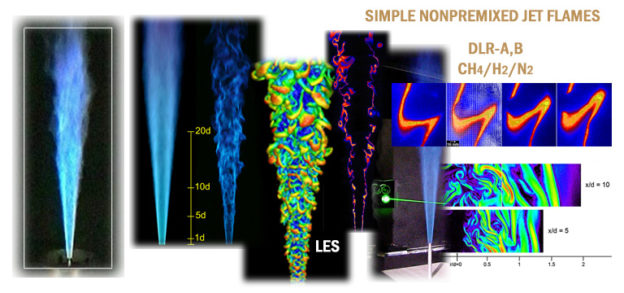
General description: Two simple jet flames of CH4/H2/N2 in low-velocity coflow are presented. Original measurements at DLR [1], which include Raman/Rayleigh scattering and planar imaging, are complemented by LDV measurements performed at the Darmstadt University of Technology and by Raman/Raleigh/LIF measurements at Sandia. The scalar data from Sandia are included in this data archive and include two cases, as listed below. The higher Re case was close to the blowoff condition and has some localized extinction. The nozzle has an inner diameter of 8.0 mm and is tapered to the thin edge.
Descriptions of the experimental methods, boundary conditions, and measurement uncertainties are included in Ref. [2], along with detailed comparisons of the two data sets (DLR and Sandia) and a discussion of finite rate chemistry effect in the Re=22800 flame.
Nozzle: d=8.0 mm inner diameter, tapered to a sharp edge.
Fuel composition: 22.1% CH4, 33.2% H2, 44.7% N2
Stoichiometric mixture fraction: Fstoic = 0.167
Flame DLR_A: Ujet=42.2 m/s; Re=15200
Movie of a turbulent CH4/H2/N2 jet flame in air running in the Turbulent Combustion Laboratory. (4.5MB)
Flame DLR_B: Ujet=63.2 m/s; Re=22800
Coflow: 0.3 m/s, 292K, 0.8% mole fraction H2O
Scalar Point Measurements (Sandia): Simultaneous Raman/Rayleigh/LIF measurements of T, N2, O2, CO2, H2O, H2, CO, OH, and NO were obtained with a spatial resolution of 0.75 mm. Results include axial profiles (x/d = 2.5 up to x/d=120) and radial profiles (x/d = 5, 10, 20, 40, 60, 80) of mean and rms values, conditional statistics, and single-shot data for each flame. Typically, 800-1000 samples were acquired at each location.
Scalar Imaging (DLR): Ref. 1 includes selected planar images of temperature (Rayleigh scattering), OH, CH, and NO. These provide information on the spatial structure on the flames. Images may be made available on the web in the future. Further information on the measurement techniques used at DLR may be found on the DLR Data Archive page.
Velocity Measurements: Two-component LDV measurements (Ref. 3) were conducted by Christoph Schneider at TU Darmstadt at locations in the flames corresponding to the scalar measurements and at additional locations closer to the nozzle. Velocity data may be downloaded from the link below. If there are questions, please, contact Andreas Dreizler at TU Darmstadt.
Primary Contacts: Wolfgang Meier (wolfgang.meier@dlr.de) and Robert Barlow (robertbarlow.bcr@gmail.com)
Acknowledgment: Support for the scalar measurements at Sandia was provided by the US Department of Energy, Office of Basic Energy Sciences, Division of Chemical Sciences.
References:
Bergmann, V., Meier, W., Wolff, D., and Stricker, W. Appl. Phys. B 66:489 (1998).
Meier, W., Barlow, R. S., Chen, Y.-L., and Chen, J.-Y., Combust. Flame 123:326-343 (2000).
Schneider, Ch., Dreizler, A., Janicka, J., “Flow Field Measurements of Stable and Locally Extinguishing Hydrocarbon-Fuelled Jet Flames,” Combust. Flame 135:185-190 (2003).
DLR_A velocity data from TU Darmstadt (Ref. 3)
Scalar Data Release 1.0 — 28-APR-00
Mass fraction archive
Mole fraction archive
These data are made available for the purpose of comparisons with model calculations. Information on measurement techniques, boundary conditions, and experimental uncertainties may be found in the references above. The scalar data are available as either mass fractions or mole fractions, where “X” in the file name designates mole fraction data and “Y” designates mass fraction data. Within each archive the “ave”, “fav” and “cnd” files contain ensemble, Favre, and conditional averages, respectively. The “all” files include complete single-shot data from each radial profile, with radius tabulated within each file. File names include the streamwise location of the radial profile (e.g., DLRB_10.Yfav contains the Favre average (and rms) mass fractions for a radial profile at x/d=10 in flame B). The “ax” and “axCnst” files contain axial profiles, with the latter being constructed from centerline data in the radial profiles as a check on the repeatability of measurements.
The “CO_LIF” data column should be used for comparisons, rather than the “CO” (Raman) column.